End-to-End Data Pipeline
Analysis Visuals
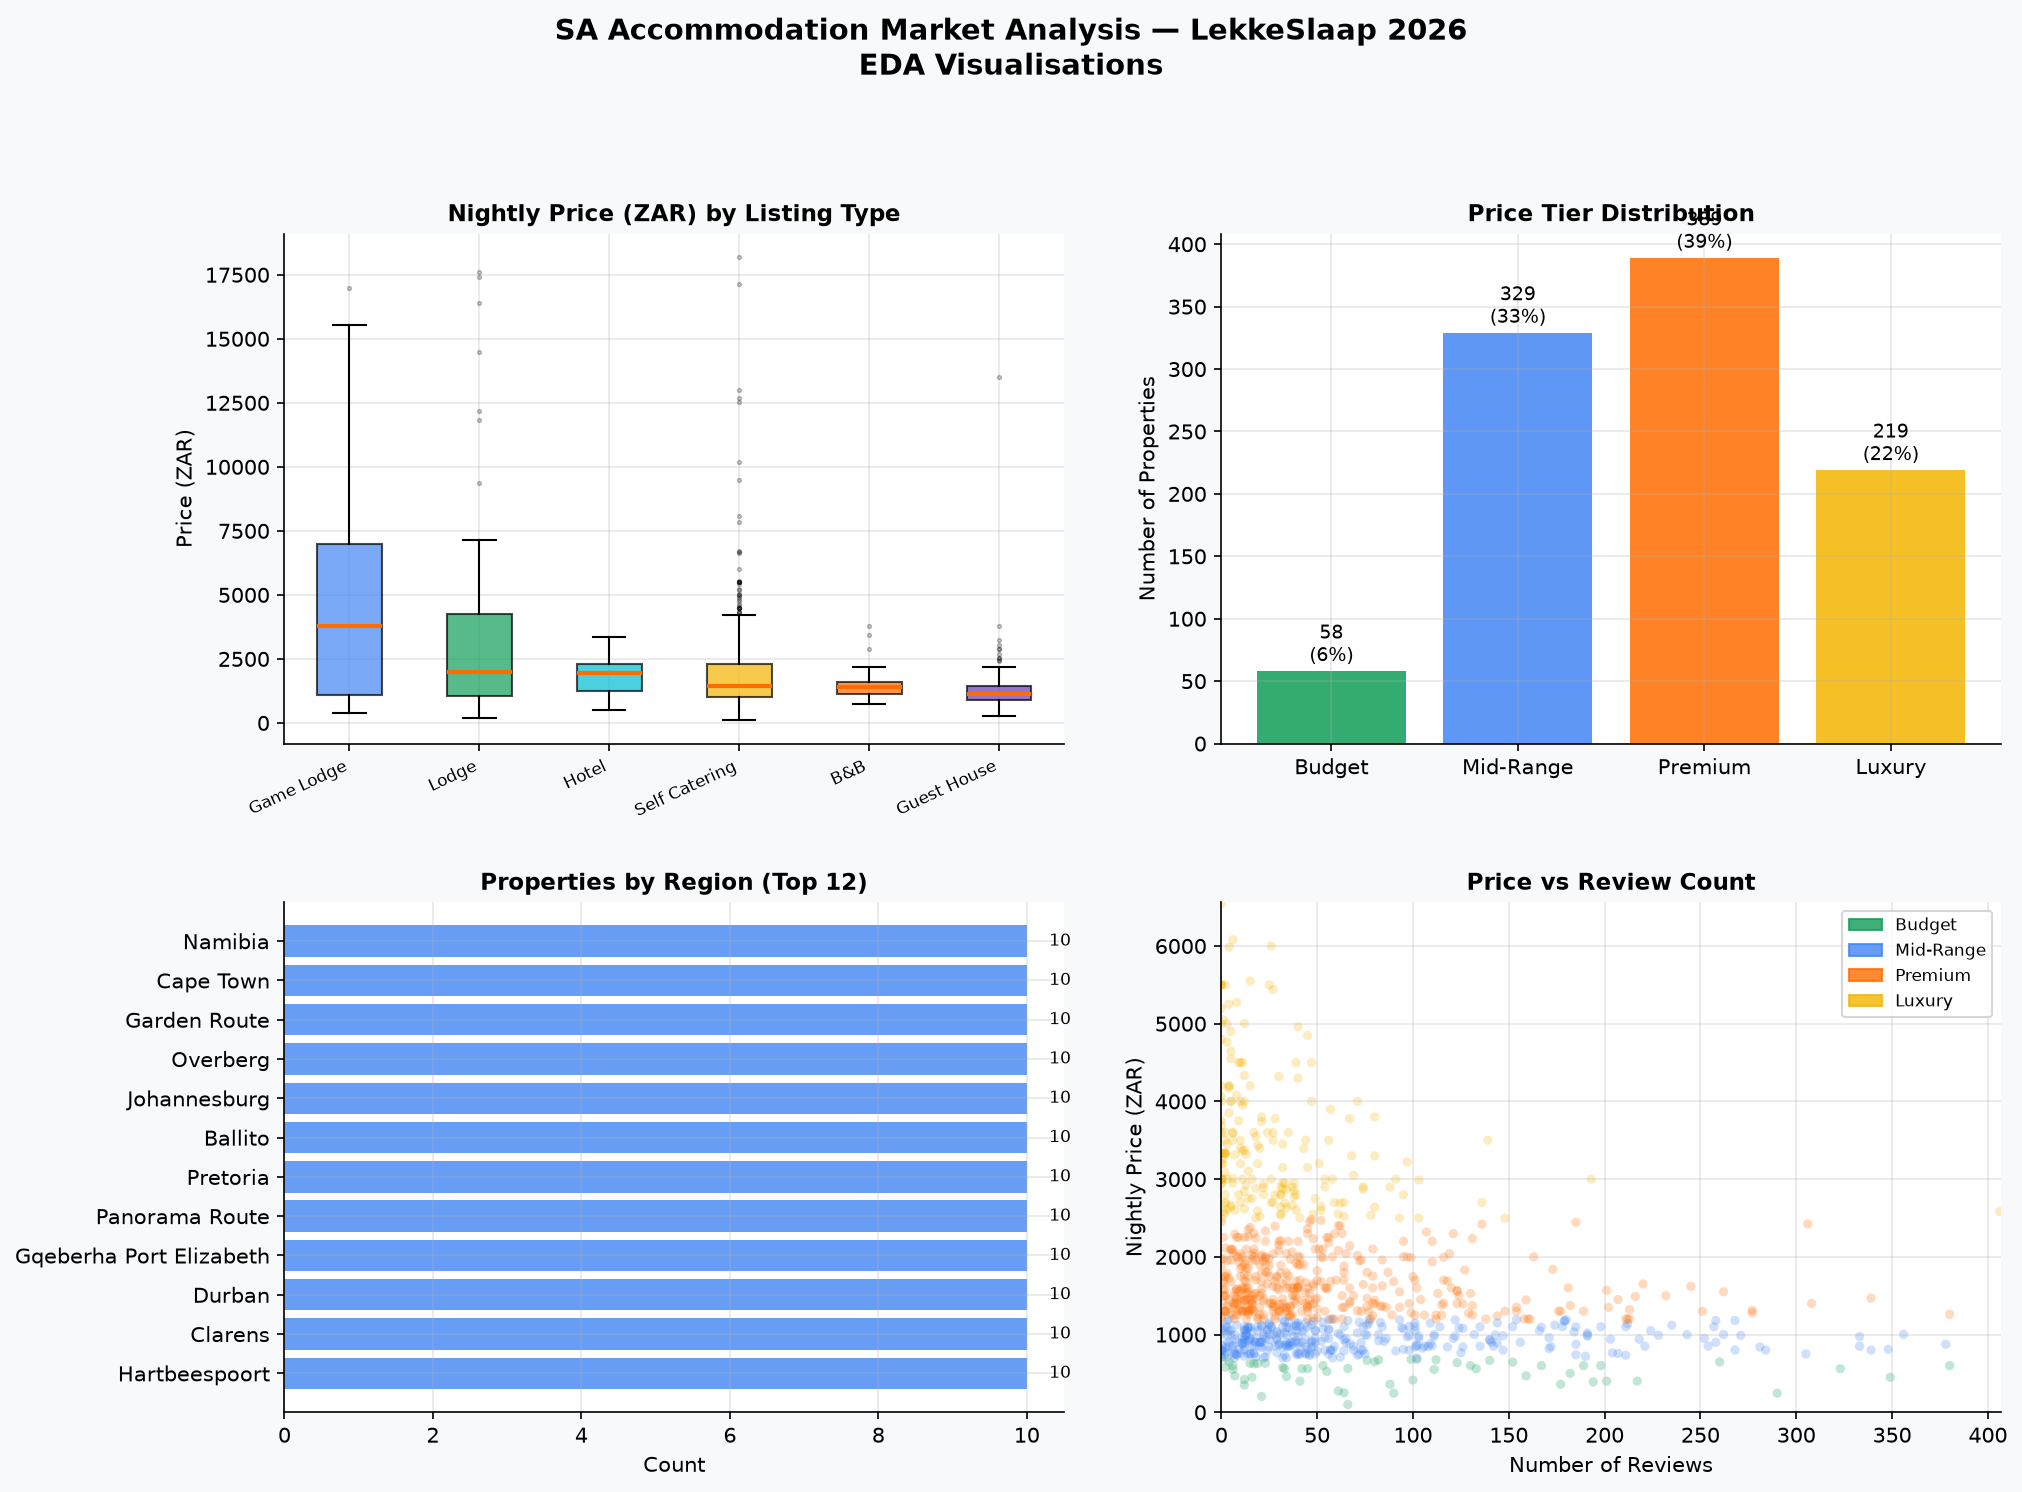
SA Accommodation Market Overview
Price distribution by listing type, tier breakdown, top regions, and price vs review count scatter — the complete market picture.
Full size ↗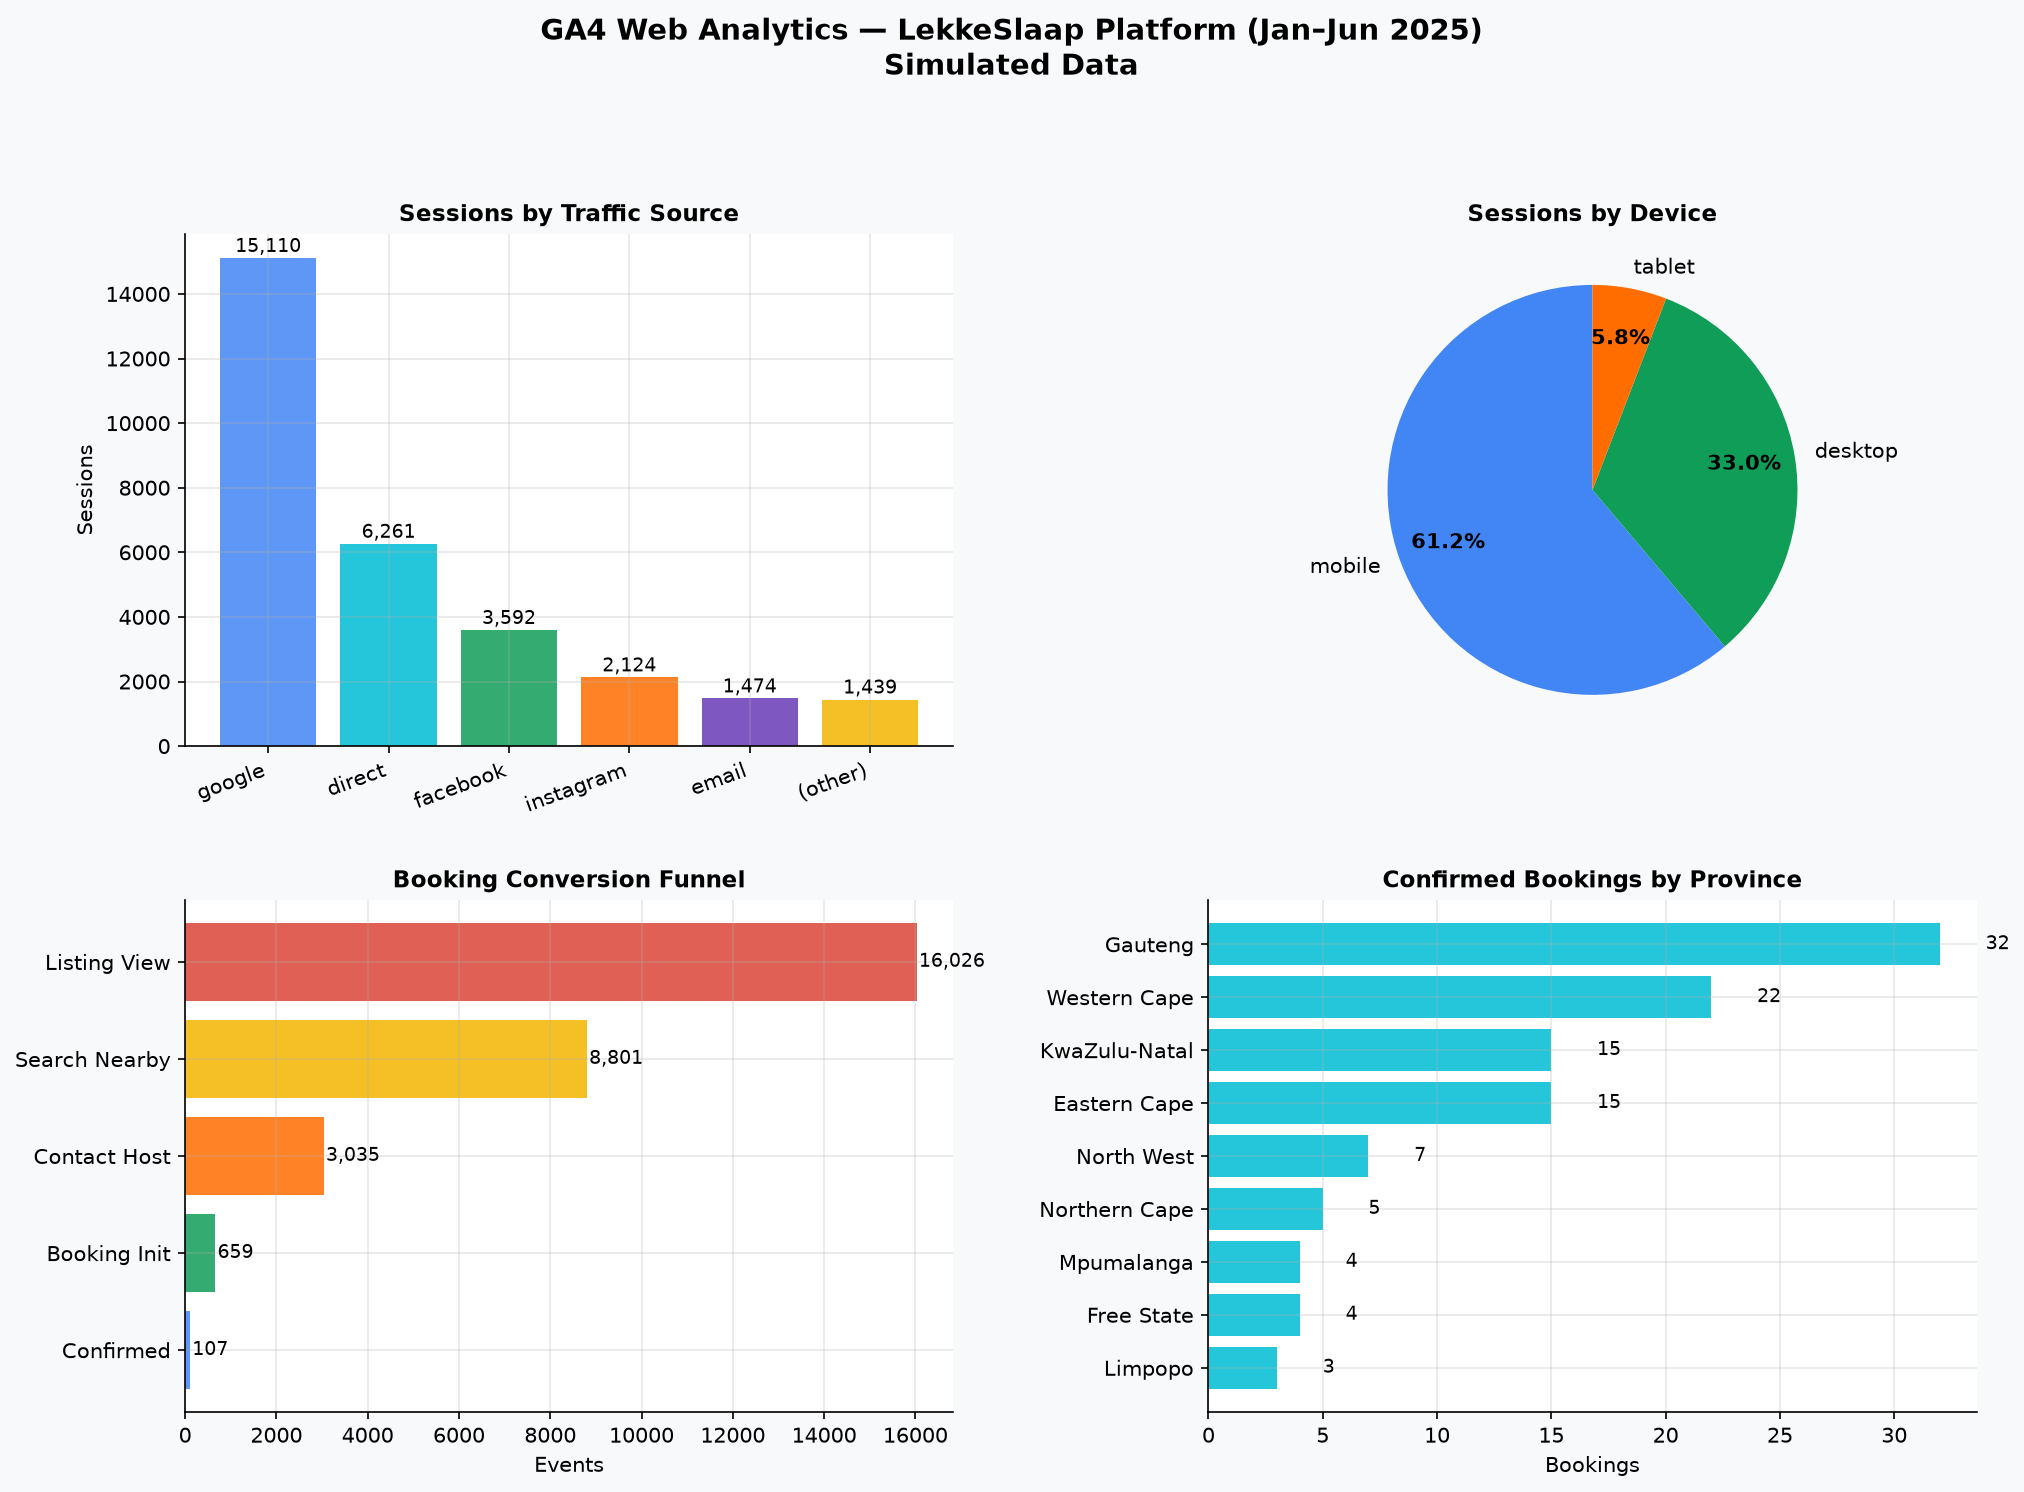
Platform Web Analytics
Traffic source split, device breakdown (61% mobile), 5-step booking funnel with drop-off rates, and confirmed bookings by SA province.
Full size ↗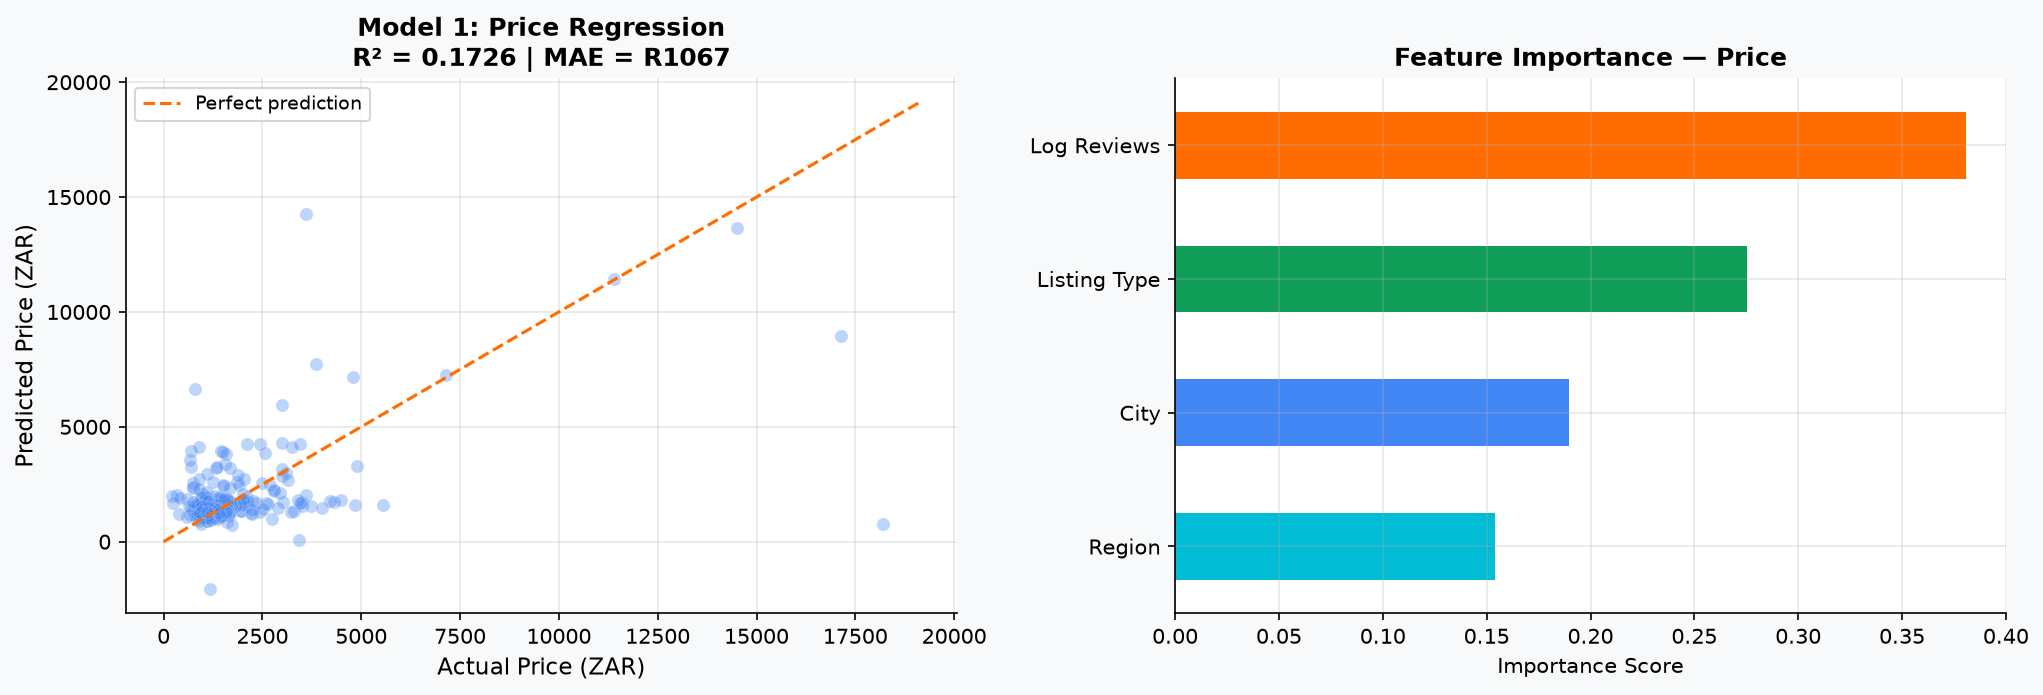
Price Regression (GBR)
Gradient Boosting predicts nightly price from listing type, region, city, and review count. Feature importance shows region is the dominant signal.
Full size ↗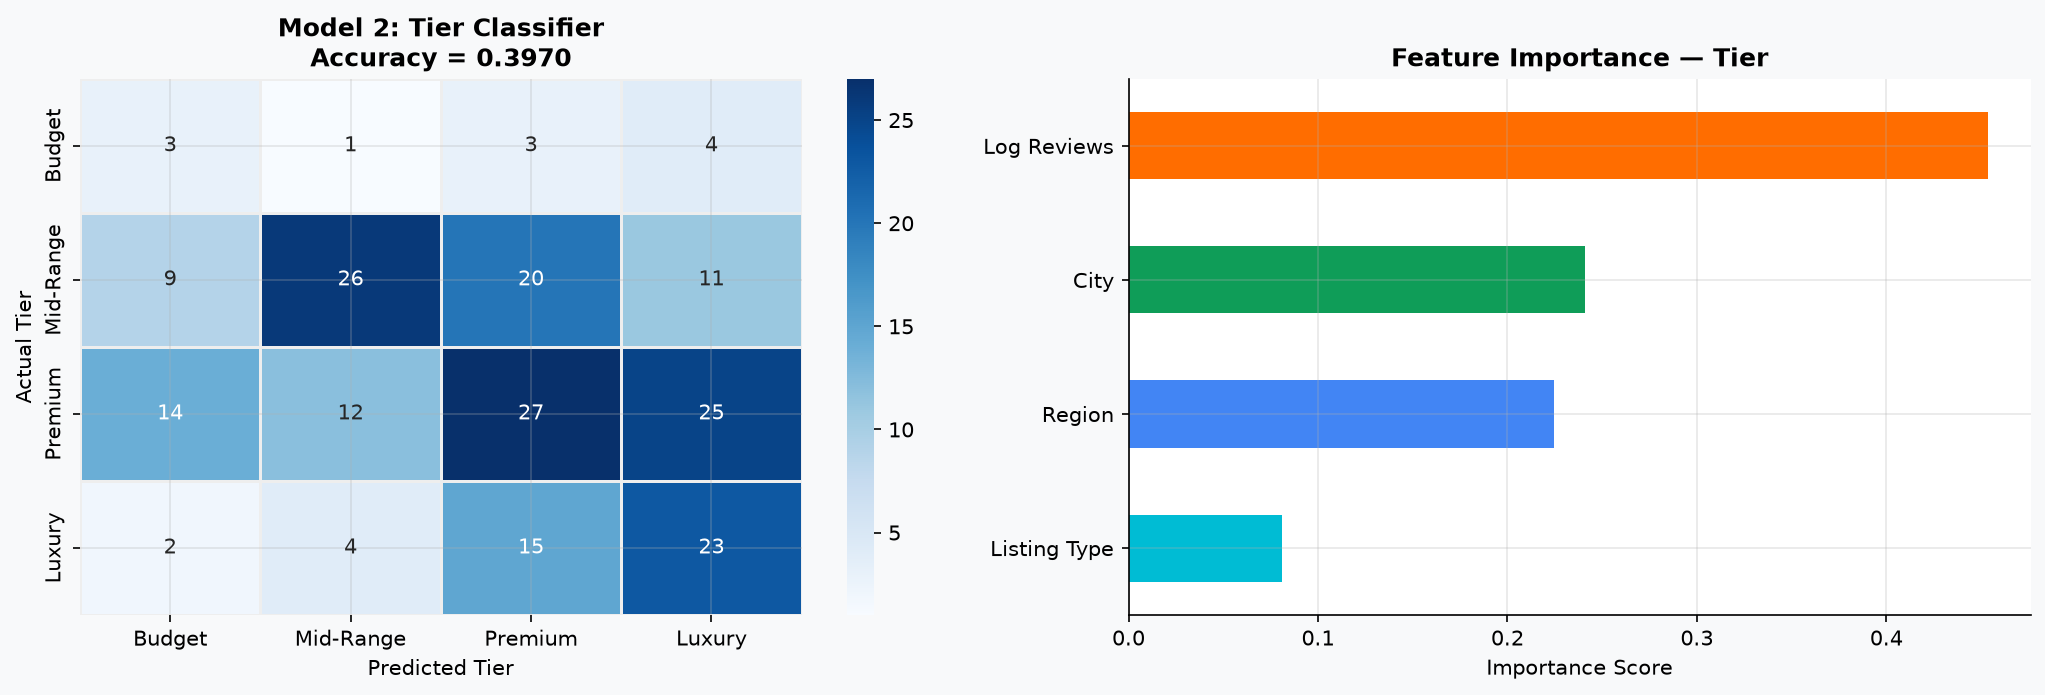
Tier Classifier (Random Forest)
4-class classifier (Budget/Mid-Range/Premium/Luxury) with confusion matrix. Balanced class weights handle the market's natural skew.
Full size ↗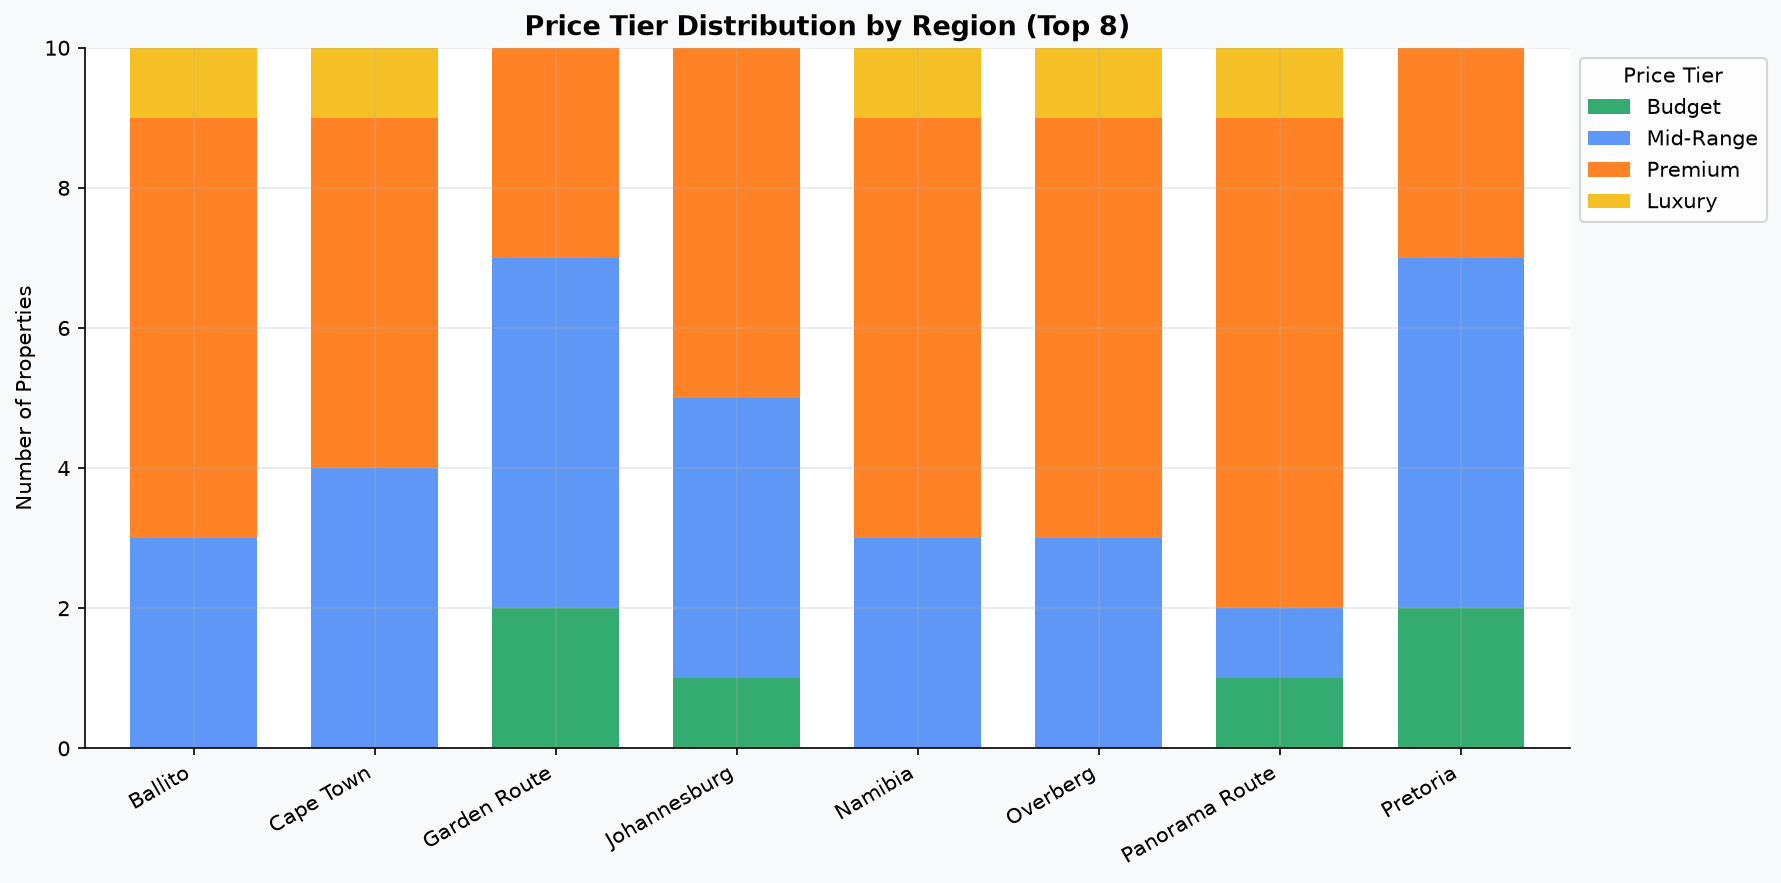
Price Tier by Region
Stacked bar showing how Budget/Mid/Premium/Luxury inventory is distributed across SA's top 8 accommodation regions.
Full size ↗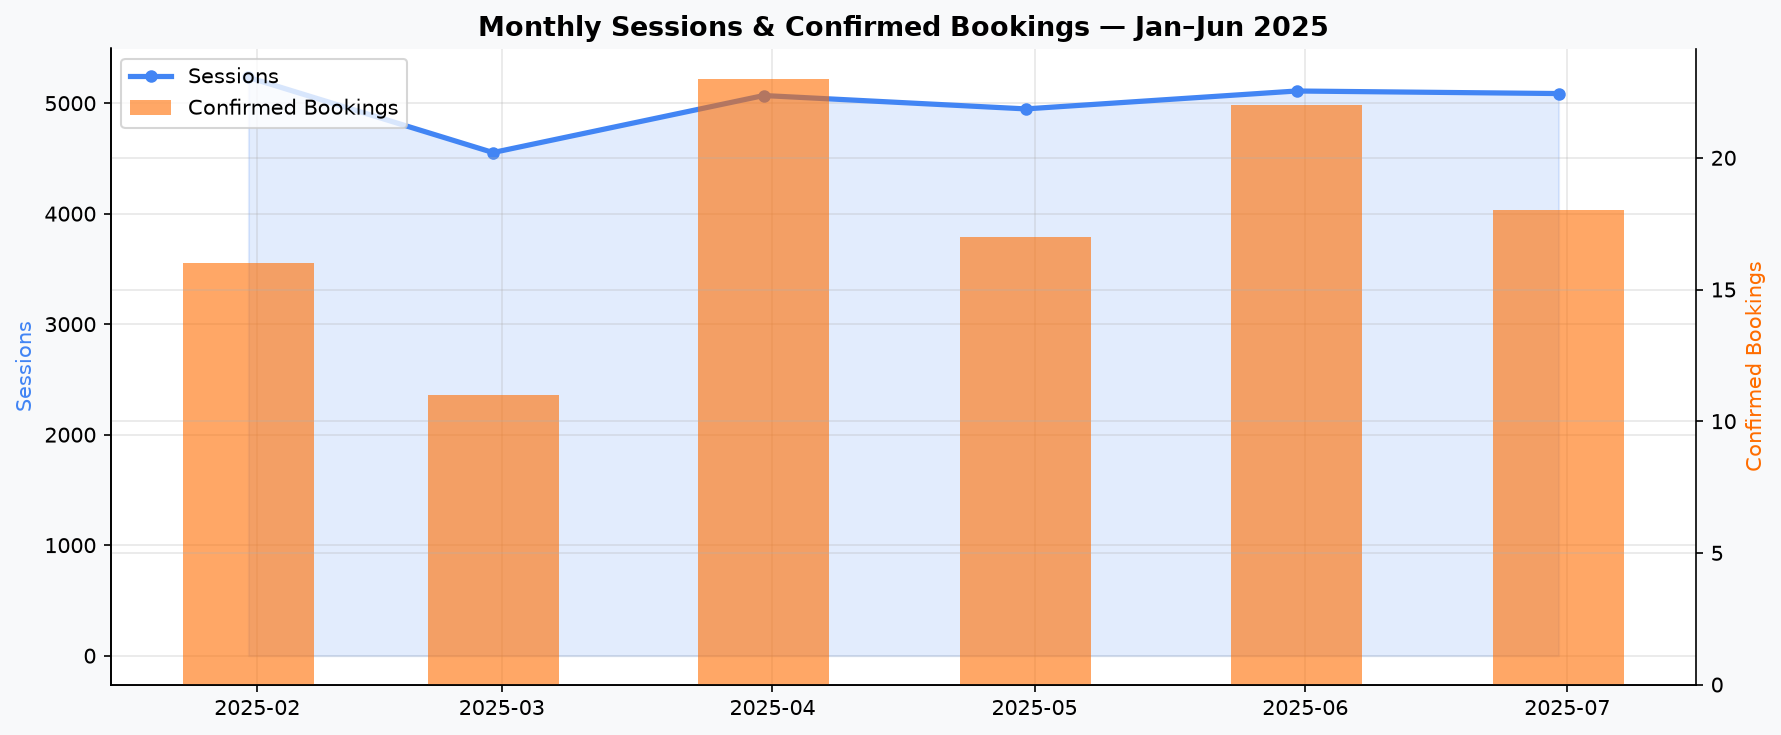
Monthly Sessions & Booking Trend
Sessions (line) overlaid with confirmed bookings (bars) across Jan–Jun 2025. SA tourism seasonality clearly visible.
Full size ↗Project Deliverables
Interactive Dashboard
Chart.js — 9 live KPIs, 6 interactive charts, GA4 funnel, POPIA consent metrics
Analytics Ebook
7-chapter narrative — dirty data, market analysis, GA4, GTM, ML, BigQuery, recommendations
Excel Workbook (8 sheets)
Cover, dirty data audit, clean data, regional analysis, GA4, ML results, predictions, GTM guide
3 ML Models
Price regression · Tier classifier · Demand scorer — 995 properties scored, predictions in BQ
BigQuery Star Schema
12 tables, africa-south1, partition + cluster optimised, 14 analytics SQL queries included
GA4 + GTM Implementation Guide
5-step booking funnel events, 7 custom dimensions, POPIA consent mode dataLayer spec
ETL Pipeline (Python)
Dirty → clean → BigQuery upload. Free ETL via bq load, Dataform, Scheduled Queries
Dirty Data Audit
8 documented issues: promo names, price formatting, duplicate locations, outliers, dupes